16 ggplot2
16.2 Resources
- ggplot2 book
- Claus Wilke’s course Data Visualization in R, book Fundamentals of Data Visualization
- What makes bad figures bad
16.3 Facets
Facet wrap using categorical columns:
ggplot(diamonds, aes(depth, price)) +
  geom_point() +
  facet_wrap(~cut)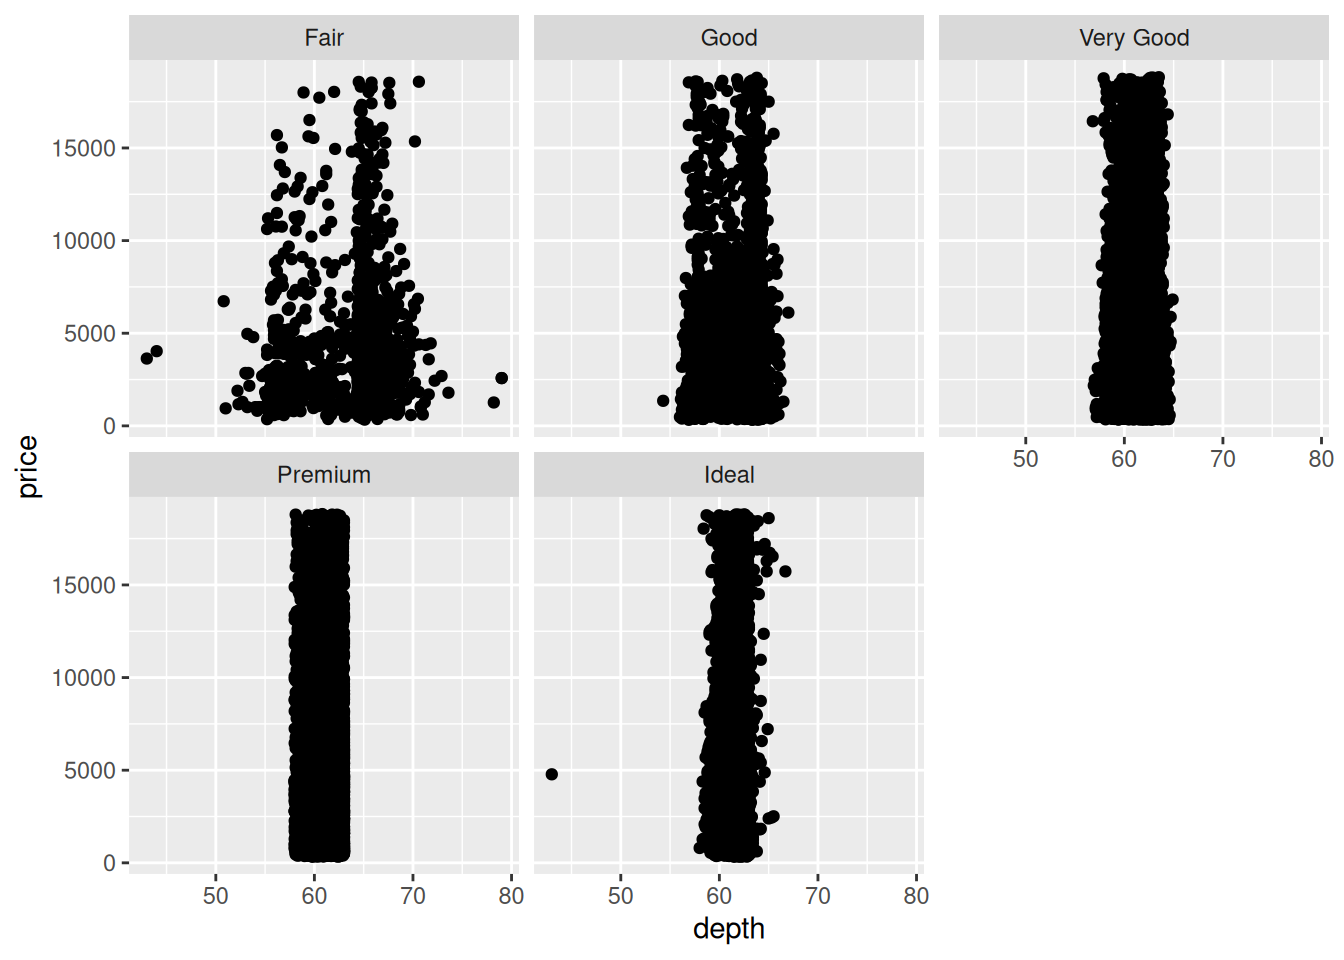
Facet wrap using automatically binned values:
“What if I look at four separate chunks of the data, with approximately the same number of points”
ggplot(diamonds, aes(depth, price)) +
  geom_point() +
  facet_wrap(~ cut_number(carat, 4))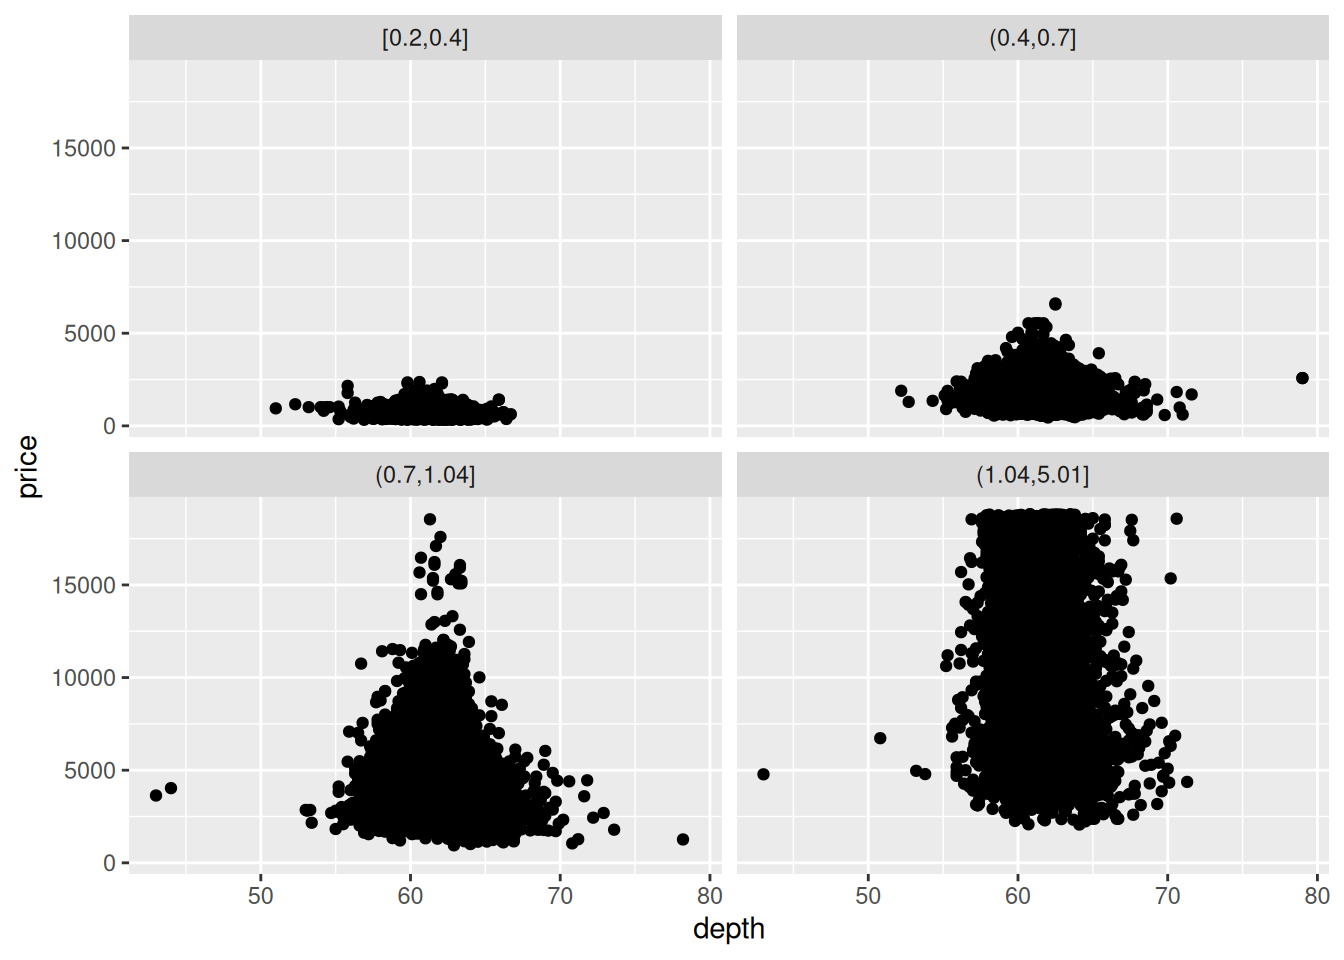
“What if I look at four separate chunks of the data, with the equal ranges in each group?”
ggplot(diamonds, aes(depth, price)) +
  geom_point() +
  facet_wrap(~ cut_interval(carat, 4))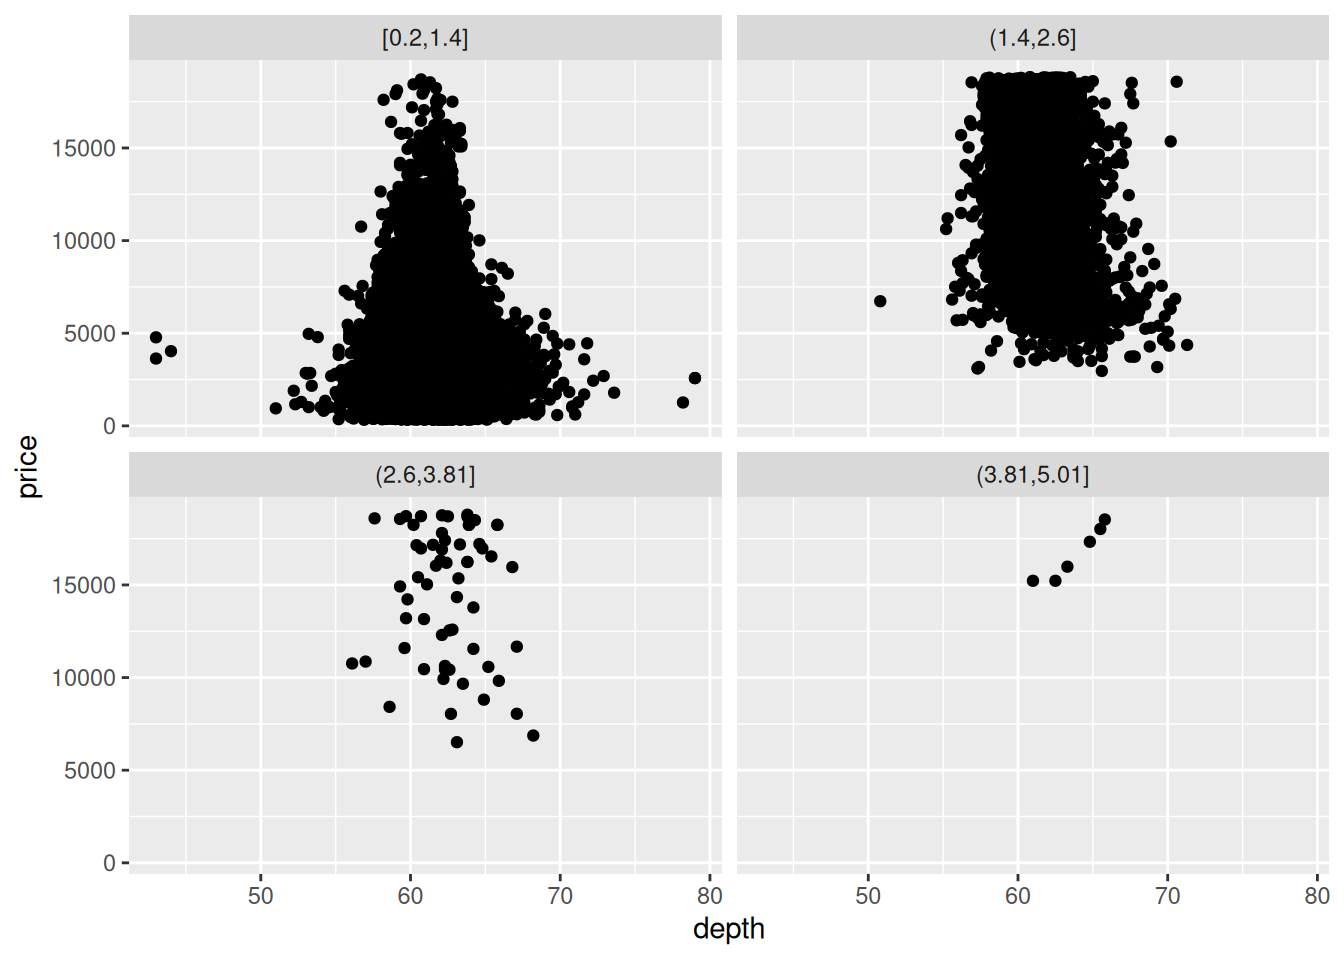
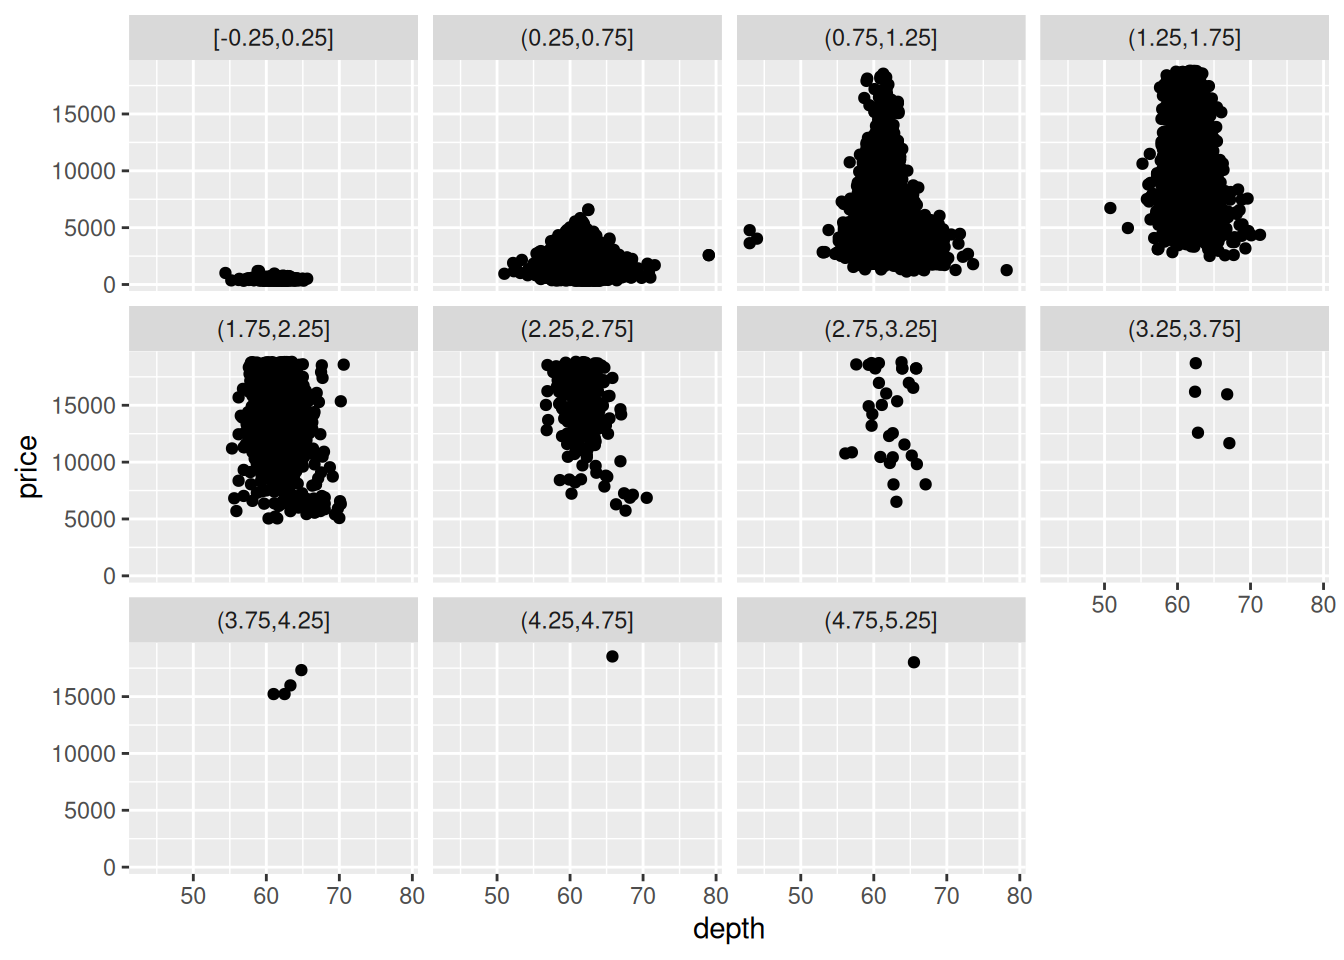
“What if I look at four separate chunks of the data, with a specific width of values in each group?”
ggplot(diamonds, aes(depth, price)) +
  geom_point() +
  facet_wrap(~ cut_width(carat, 0.5))